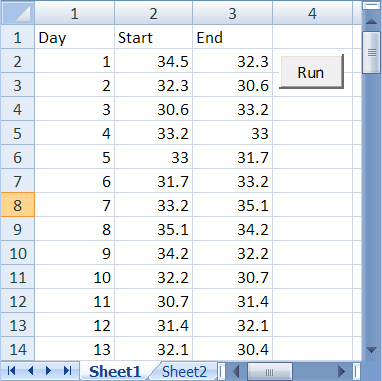
Download this worksheet. It has prices at the start and end of each day:

You program can't be sure how many day's data are in the worksheet.
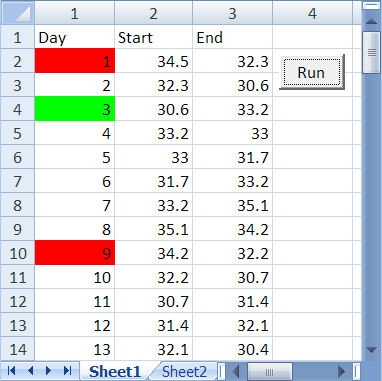
Add code that will mark large price changes. When the daily price rises by 2 or more, mark the day green. When the price falls by 2 or more, mark it red. Like this:

The first row does not contain data.
Upload your solution. The usual coding standards apply.
When you submit, please answer this question: What did you learn from this exercise? Type in the text area on the solution form.
(If you were logged in as a student, you could submit an exercise solution, and get some feedback.)
Keywords:
