Basic data analysis programs

Keywords: 

People who write business programs, whether they're full-time programmers or not, spend much of their time on data analysis programs. Executives and managers rely on the analyses to run the company.

Many basic analysis programs have a similar structure. In this lesson, we'll take at look at that common pattern.

There's much more to data analysis than this. Building statistical models, writing simulations, real-time analysis… there are whole university degrees in this stuff. The programs we'll write only do the most basic forms of analysis.

What a typical analysis program looks like

Extract
Process
Output

That's a pattern.

Pattern

Basic data analysis

Situation:
You have a bunch o' data. You're asked to write a program to summarize or transform the data in some way.
Actions:
Use the pattern:

Extract
Process
Output

This is a variant of the input-process-output pattern.

Example

The national Camel Dancing Exams are a Big Deal in the camel world. The best camels get endorsement deals ("Red Bull helps me strut my stuff"), appearances in Dancing with the Ungulates and Strictly Camel Dancing, and other goodies.

There are ten testing centers. Examiners send results to Dromedary and Bactrian, independent auditors who certify the results. Testing centers send their data by email, fax, pigeon, or shouting really loudly. Most of the time the data gets through OK, but sometimes there are errors.

Test scores range from 0 to 50, theoretically. However, scores less than 20 or greater than 40 are unusual. Those scores are outliers.

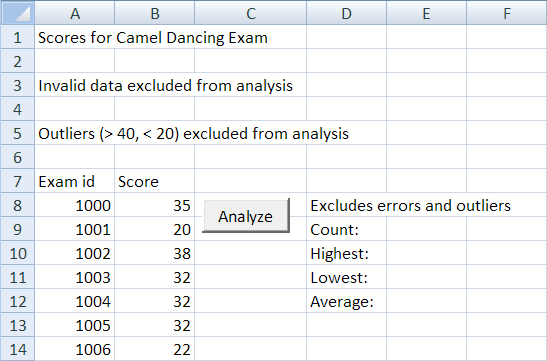
You work for D&B. Your boss, Sheldon Spittyface, asks you to write a program to analyze the test data. He wants to know the highest, lowest, and average score. He wants you exclude data errors (e.g., nonnumeric data), and outliers.

Here's what the worksheet looks like to start:
Start

Main program

The main program follows the extract-process-output pattern. Here it is.

  1. Private Sub cmdAnalyze_Click()
  2.     Dim validData(1000) As Integer
  3.     Dim count As Integer
  4.     Dim highest As Integer
  5.     Dim lowest As Integer
  6.     Dim average As Single
  7.     'Extract the valid data.
  8.     extractValidData count, validData
  9.     'Is there enough data to analyze?
  10.     If count < 1 Then
  11.         MsgBox "Sorry, there is not enough data to analyze."
  12.         End
  13.     End If
  14.     'Compute stats.
  15.     computeStats count, validData, highest, lowest, average
  16.     'Output stats.
  17.     outputStats count, highest, lowest, average
  18. End Sub
Simon
Simon
Tara, when you're writing code, so you usually write the Dim statements first?
Tara
Tara
No, not usually. I write the code, and figure out which variables I need as I go along.
This code is for the Extract part of the pattern:

  1.     'Extract the valid data.
  2.     extractValidData count, validData
  3.     'Is there enough data to analyze?
  4.     If count < 1 Then
  5.         MsgBox "Sorry, there is not enough data to analyze."
  6.         End
  7.     End If
Your program doesn't know how much data it's going to get. It should return a count of the number of valid values, along with the data itself.

Now that you know what params extractValidData will need, you can declare them:

  1.     Dim validData(1000) As Integer
  2.     Dim count As Integer
validData is an array, with 1,000 elements. Since there have never been more than 300 CDE scores, that should be enough for a long time.

Here's the pattern again:

Extract
Process
Output

The next part is Process.

  1.     'Compute stats.
  2.     computeStats count, validData, highest, lowest, average
Send computeStats the number of data elements, and the data. Get back from it the stats the Boss wanted: highest, lowest, and average. You need to declare those variables:

  1.     Dim highest As Integer
  2.     Dim lowest As Integer
  3.     Dim average As Single
The pattern again:

Extract
Process
Output

The last part is Output:

  1.     'Output stats.
  2.     outputStats count, highest, lowest, average
Send outputStats the things it needs to output, and it will figure out how.

Let's work on each of the subs.

Extract to array

The extraction sub is called like this:

  1.     'Extract the valid data.
  2.     extractValidData count, validData
The sub runs through the data in the worksheet, until it gets to the end. We know how to do that, with this loop you've seen before:

  1. row = 0
  2. Do While Cells(row + 1, 1) <> ""
  3.     row = row + 1
  4. Loop
If you don't know how this works, see Finding the end.

You need to mix in with this tests, to make sure the data is OK. The flag pattern helps. Something like this:

  1. row = 0
  2. Do While Cells(row + 1, 1) <> ""
  3.     dataOK = True
  4.     If [some bad thing] Then
  5.         dataOK = False
  6.     EndIf
  7.     If [another bad thing] Then
  8.         dataOK = False
  9.     EndIf
  10.     [Repeat as many tests as needed]
  11.     If dataOK Then
  12.         [Copy data to array]
  13.     End If
  14.     row = row + 1
  15. Loop
If this isn't familiar, check Extracting to arrays.

Here's the code for the camel program:

  1. 'Extract valid data from raw data.
  2. 'Params:
  3. '  count: number of valid data items (out)
  4. '  validData: array of valid data items (out)
  5. Sub extractValidData(count As Integer, validData)
  6.     Dim row As Integer
  7.     Dim dataStartRow As Integer
  8.     Dim dataValue As String
  9.     Dim dataOK As Boolean
  10.     'What row the data starts in.
  11.     dataStartRow = 8
  12.     'Current raw data row.
  13.     row = 0
  14.     'Count of valid data.
  15.     count = 0
  16.     'Does the next row have data in it?
  17.     Do While Cells(row + dataStartRow, 2) <> ""
  18.         'Get the next data value.
  19.         dataValue = Cells(row + dataStartRow, 2)
  20.         'Validate it.
  21.         'Set flag.
  22.         dataOK = True
  23.         'Change flag if there is an error.
  24.         If Not IsNumeric(dataValue) Then
  25.             dataOK = False
  26.         ElseIf dataValue < 20 Or dataValue > 40 Then
  27.             dataOK = False
  28.         End If
  29.         'Did the data pass the tests?
  30.         If dataOK Then
  31.             'Data is OK. Copy to extracted data array.
  32.             count = count + 1
  33.             validData(count) = dataValue
  34.         End If
  35.         'Go to the next raw data row.
  36.         row = row + 1
  37.     Loop
  38. End Sub
Compare it with the pseudocode above it. It's much the same, but with the details filled in.

The loop test is a little different:

Do While Cells(row + dataStartRow, 2) <> ""

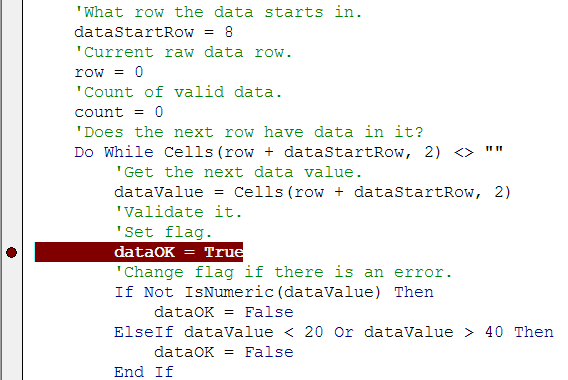
The 2 is because the data is in row 2. dataStartRow is because the data doesn't start at row 1 of the worksheet:

Start

dataStartRow is an offset variable. It just moves the processing down a bit.

Klaus
Klaus
It says:

Do While Cells(row + dataStartRow, 2) <> ""

The code we had before was:

Do While Cells(row + 1, 1) <> ""

Should the new code be:

Do While Cells(row + dataStartRow + 1, 2) <> ""

To get the arithmetic right.

Tara
Tara
Good question. No, the code is correct as is. Finding the exact starting point can be tricky. I recommend you test it out in a debugger.

Let's see how. If the code is right, what's the first data value that extractValidData should process?

Klaus
Klaus
Well, let me check out the worksheet.

Start

The first score is 35. That should be the first value that extractValidData looks at.

Tara
Tara
Good! Now let's add a breakpoint, so we can check that the code is working.

Breakpoint

The breakpoint is just after the line that sets dataValue. dataValue should be 35 the first time program hits the breakpoint.

OK, let's run the program and find out:
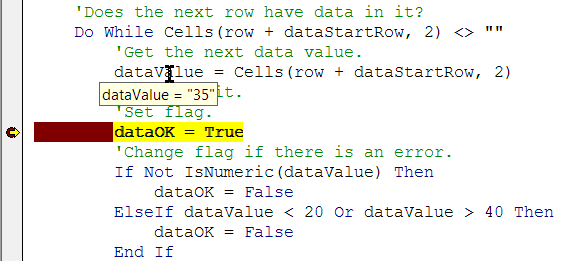
Breakpoint result

Yay! It's 35, just what we expected.

Lily
Lily
Klaus was right to ask that question, though?
Tara
Tara
Yes, absolutely! If you're uncertain about something, don't leave it hanging. Check it out. Breakpoints are good for that.

That's what professional programmers do. There's so much that can go wrong in a program. Eliminating potential errors will make you scream less.

Jeremy
Jeremy
Hey, dude! You're a pro!
Klaus
Klaus
No doubt, dude, no doubt.

Simon
Simon
Hey, I noticed something else. Check out the signature for the sub:

Sub extractValidData(count As Integer, validData)

validData doesn't have a data type, like Integer.

Tara
Tara
Well spotted, Simon! When you pass arrays, it's best to leave out the data type.

Process array

That's the extract sub. Now for the processing sub. It's called like this:

  1.     'Compute stats.
  2.     computeStats count, validData, highest, lowest, average
The code for the sub will be like what we've seen before, with the accumulator pattern.

Pattern

Accumulator

Situation:
You want to summarize some aspect of a data set, like the average, or highest value.
Actions:
Use a variable as an accumulator.

  • Initialize the variable.
  • Loop over the cells you want to process. Update the value of the accumulator each time through the loop.
  • After the loop, the accumulator has the value you want.

  1. 'Compute statistics. Assumes data is valid.
  2. 'Params:
  3. '  count: number of valid data items (in)
  4. '  validData: array of valid data items (in)
  5. '  highest: highest score (out)
  6. '  lowest: lowest score (out)
  7. '  average: average score (out)
  8. Sub computeStats(count As Integer, validData, _
  9.         highest As Integer, lowest As Integer, average As Single)
  10.     Dim total As Long
  11.     Dim index As Integer
  12.     'Initialize from the first data value.
  13.     highest = validData(1)
  14.     lowest = validData(1)
  15.     total = validData(1)
  16.     'Loop across the rest of the data.
  17.     For index = 2 To count
  18.         'Add current value to total.
  19.         total = total + validData(index)
  20.         'Is current value higher than highest so far?
  21.         If validData(index) > highest Then
  22.             highest = validData(index)
  23.         End If
  24.         'Is current value lower than lowest so far?
  25.         If validData(index) < lowest Then
  26.             lowest = validData(index)
  27.         End If
  28.     Next index
  29.     'Compute average.
  30.     average = total / count
  31. End Sub
​ Not much new here, except that this time you're processing an array.

When writing code like this, it's good to work backwards. For example, you need the average. That's the total divided by the count. You already have the count from the extraction routine. For the total, use the accumulator pattern.

Lily
Lily
I did notice one thing different, that I kinda like. Look at the comments:

'Params:
'  count: number of valid data items (in)
'  validData: array of valid data items (in)
'  highest: highest score (out)
'  lowest: lowest score (out)
'  average: average score (out)

They each have (in) or (out) at the end. Shows whether the params is for sending data into the sub, or for getting data out.

Tara
Tara
Ay caramba! That's well spotted! Yes, I like that, too. Makes it easier to understand what the sub is doing.

Output

The last chunk. Here's the call:

  1.     'Output stats.
  2.     outputStats count, highest, lowest, average
Here's the code.

  1. 'Output statistics to worksheet.
  2. 'Params:
  3. '  count: number of valid data items (in)
  4. '  highest: highest score (in)
  5. '  lowest: lowest score (in)
  6. '  average: average score (in)
  7. Sub outputStats(count As Integer, highest As Integer, _
  8.         lowest As Integer, average As Single)
  9.     Cells(9, 5) = count
  10.     Cells(10, 5) = highest
  11.     Cells(11, 5) = lowest
  12.     Cells(12, 5) = Round(average, 1)
  13. End Sub

Variants

Here's the pattern again:

Extract
Process
Output

When using patterns, remember that they're guides, not cut-and-paste templates. Often you need to change them to fit business requirements. Take data extraction:

  • From a worksheet to an array.
  • From a worksheet to another part of the same worksheet.
  • From a worksheet to a different worksheet.
  • From a worksheet to a worksheet in a different workbook.
  • From a file to a worksheet.
  • From a file to an array.

The logic for each of them is essentially the same. There's a data source, with the raw data. There's a destination, for the extracted data. There's a loop that reads the raw data. There's a flag and some If statements, to decide when to copy the data.

Part of programming is looking beneath the surface, and seeing the logic underneath. If you just rely on surface thinking, you won't get very far.

In the rest of this section, let's look at variants of the extract, process, and output chunks.

Exercises
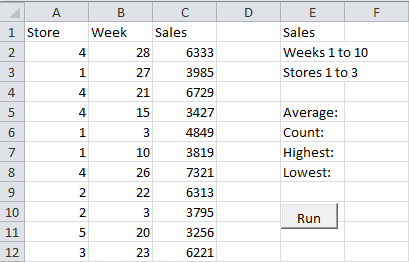
Exercise: Sales for some stores
Download the starting spreadsheet. It looks like this:

Start

(The data got a bit scrambled.)

Output sales statistics, but only for stores 1 to 3, and weeks 1 to 10. You can assume that all the data is valid.

Upload you solution.

Attachments

partial-sales-start.xlsm

(If you were logged in as a student, you could submit an exercise solution, and get some feedback.)

Summary